Before AI v/s After AI
KPI COUNTERS – THE SCOREBOARD
Avg. Delay Cost/Shipment- $29
Before AI:$ 37
After AI:$ 8
Scrap Cost/Yr↓ 28%
Before AI:4.3 kg
After AI: 3.1 kg
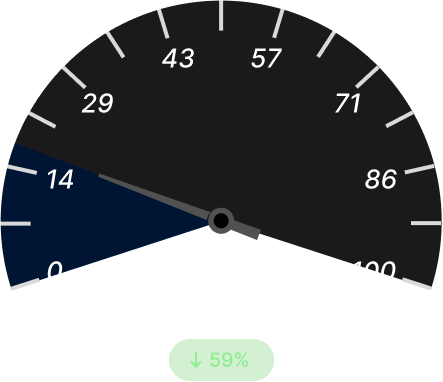
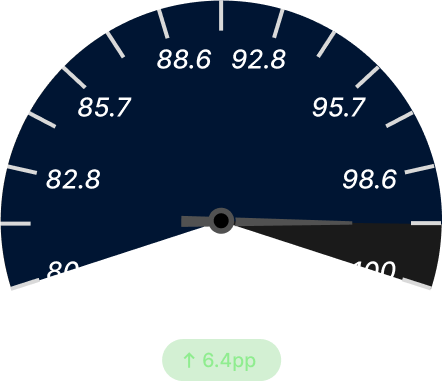
On‑Time Delivery (OTD)
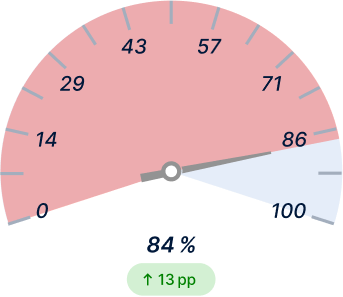
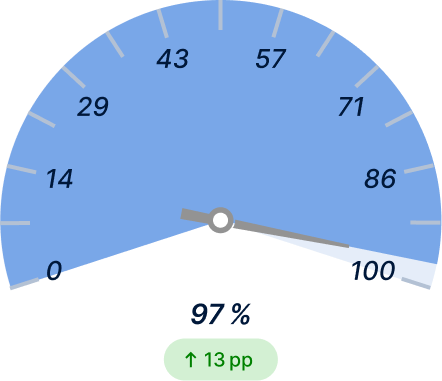
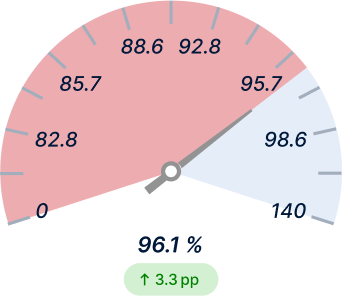
Empty‑Mile Ratio
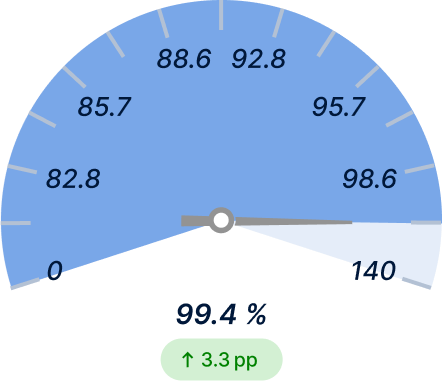
Warehouse Pick Accuracy
Why Change?
Pain-Point Matrix
Last‑Mile Chaos
Unpredictable traffic & failed deliveries hurt NPS.
View Our AI Fix
View Our AI Fix
Last‑Mile Chaos
RL route optimiser adapts in real time; dynamic re‑slotting for failed drops.
View On‑Screen Friction
View On‑Screen Friction
Empty‑Mile Waste
Trucks return half‑full, burning diesel & profit.
View Our AI Fix →
View Our AI Fix →
Empty‑Mile Waste
Network‑wide load‑matching engine pairs backhauls & cross‑docks.
View On‑Screen Friction
View On‑Screen Friction
Dock Congestion
Queueing at warehouses adds idle hours & penalties.
View Our AI Fix
View Our AI Fix
Dock Congestion
Vision + queuing AI predicts berth times; auto‑schedules staggered arrivals.
View On-Screen Friction
View On-Screen Friction
Cold‑Chain Compliance
Temperature excursions trigger product loss & recalls.
View Our AI Fix
View Our AI Fix
Cold‑Chain Compliance
Edge IoT sensors feed LSTM anomaly detection; triggers reroute or dry‑ice top‑up.
View On-Screen Friction
View On-Screen Friction
Customs & Trade Docs
Manual paper forms stall border clearance.
View Our AI Fix
View Our AI Fix
Customs & Trade Docs
LLM parses invoices, SKU HS codes; auto‑creates compliant eDocs (ACE, CDS).
View On-Screen Friction
View On-Screen Friction
Returns Tsunami
E‑commerce returns bloat reverse logistics cost.
View Our AI Fix
View Our AI Fix
Returns Tsunami
Demand‑sensing AI clusters return hubs, pre‑positions inventory & labor.
View On-Screen Friction
View On-Screen Friction
Fleet Breakdown Surprises
Roadside failures derail schedules.
View Our AI Fix
View Our AI Fix
Fleet Breakdown Surprises
Vibration & CAN‑bus AI predicts breakdowns days in advance; schedules maintenance.
View On-Screen Friction
View On-Screen Friction
Lack of Real‑Time Visibility
KPIs scattered in siloed spreadsheets.
View Our AI Fix
View Our AI Fix
Lack of Real‑Time Visibility
Unified control‑tower dashboard streams IoT, AIS, WMS, and TMS data.
View On-Screen Friction
View On-Screen Friction
Carbon Footprint Pressure
ESG targets demand emissions cuts.
View Our AI Fix
View Our AI Fix
Carbon Footprint Pressure
Optimiser balances mode, load, and speed for minimum CO₂ per kg‑km.
View On-Screen Friction
View On-Screen Friction
AI Solutions
Route Optimiser
Key points
- AI-driven route planning using live traffic and delivery constraints.
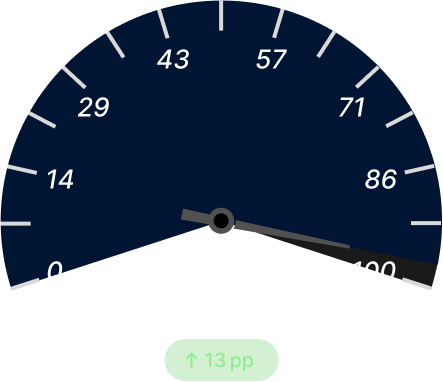
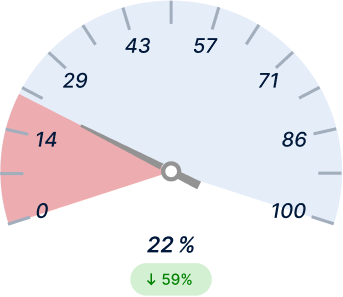
- Reduces fuel consumption by up to 22 %.
- Integrates with ERP and TMS for seamless dispatch optimization.
Predictive Fleet Maintenance
Key points
- Detects early signs of component wear using IoT sensor data.
- Minimizes unplanned breakdowns by up to 35 %.
- Supports telematics platforms for real-time diagnostics.
Warehouse Vision QC
Key points
- Computer vision system for automated SKU and pallet inspection.
- Boosts accuracy and safety compliance by 28 %.
- Integrates with existing WMS infrastructure.
Demand & Inventory Planner
Key points
- AI-driven demand forecasting for SKU-level accuracy.
- Optimizes reorder points and reduces holding costs by up to 20 %.
- Integrates with SAP IBP / Kinaxis for dynamic planning.
Customs Doc Intelligence
Key points
- Automates customs form classification and anomaly detection.
- Cuts documentation processing time by 40 %.
- Enhances compliance accuracy with OCR and NLP-based validation.
Demand Planner
Key points
- Leverages AI-driven forecasting to predict demand across regions and SKUs.
- Improves forecast accuracy by up to 25 %, minimizing stockouts and overstocking.
- Integrates with ERP and supply chain systems for continuous S&OP alignment.
Under the hood
Technical Architecture
- Teltonika / Samsara telematics
- BLE temp beacons
- MQTT <200ms
- PyTorch Lightning → ONNX, Triton inference
- GraphRL for routing
- BERT‑fine‑tuned LLM for customs docs
- FastAPI micro‑services (Docs Intelligence, Cost Optimiser, ESG Engine)
- Confluent Kafka
- Snowflake lakehouse
- Delta clone
- AIS & weather APIs
- Kubeflow
- Argo CD
- ISO27001 & TAPA
- React + D3 control tower
- Grafana fleet metrics
- AR glasses for dockyards
Implementation Blueprint
Phase 1: Discover & Data Audit
- Fleet + warehouse walk‑through
- sensor map
- sample doc extraction
- ROI hypothesis.
Phase 2: Rapid Pilot
- One lane + one customs flow instrumented
- baseline KPIs captured
Phase 3: Shadow validation
- 24×7 inference in parallel
- planner & driver feedback loop
Phase 4: Production Launch
- TMS/WMS integration live
- Staff training
- SLA activated
Phase 5: Continuous Optimisation
- KPI review
- model retrain
- feature backlog burn‑down
ROI Calculator
Fuel Savings:
Delay Savings:
CO₂ reduction:
Trust & Compliance Badges


The Fast Lane
Give us 30minutes. We'll map a milestone‑based AI path that pays for itself.
Why Choose Us
Proven Results,
Trusted by Experts
Futuristic Visuals
From fleet heatmaps to route optimization overlays, our UI is engineered to give logistics teams instant visibility across hubs, lanes, and delivery networks.
Trusted by Industry Leaders
Adopted by global 3PLs, freight operators, and supply chain platforms, benchmarked against world-class logistics efficiency frameworks.
Loss Aversion
Without AI:
Routes stay inefficientEmpty miles continue risingDelays cascade across the chain
We help plug revenue losses with real-time optimization.
Small Steps, Big Impact
A quick consultation reveals how demand forecasting and route intelligence can transform operational margins within weeks.