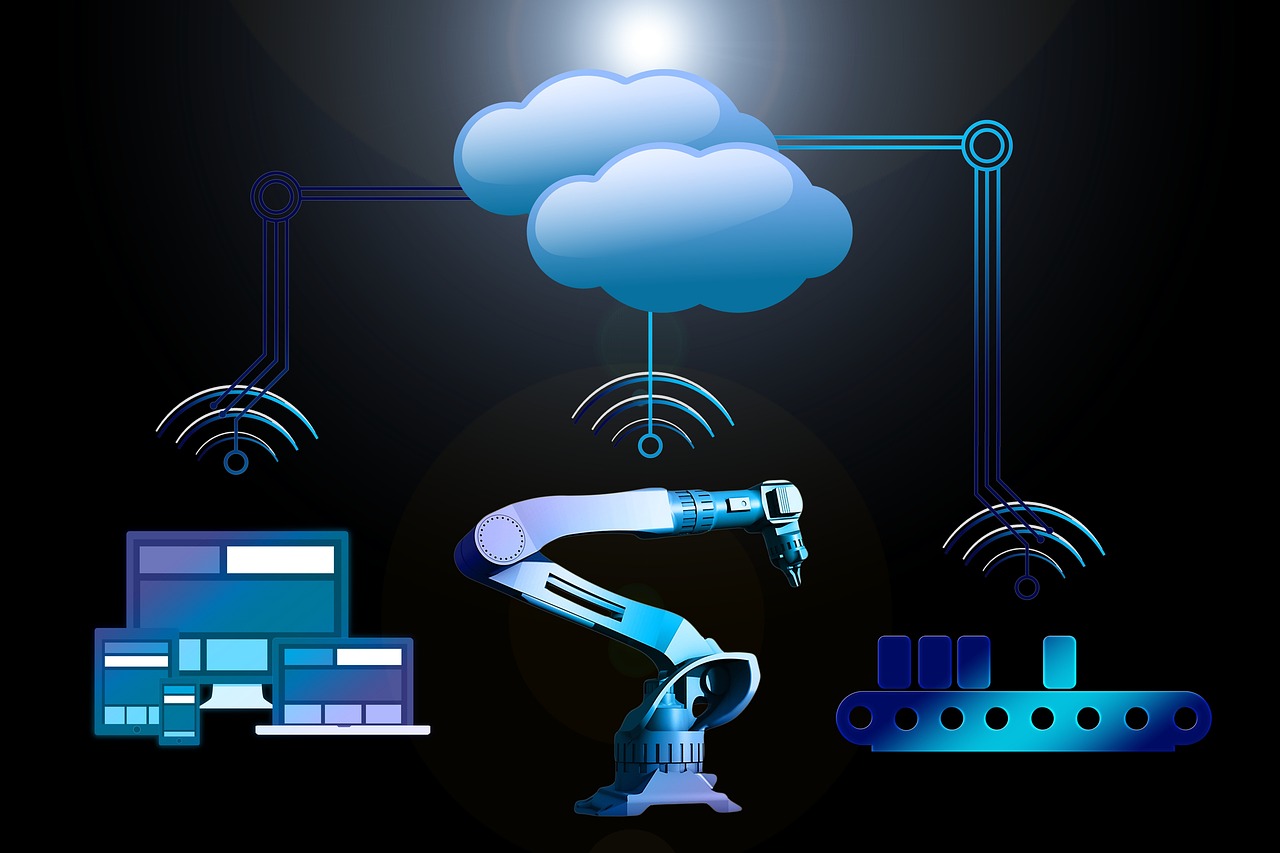
Before AI v/s After AI
KPI COUNTERS – THE SCOREBOARD
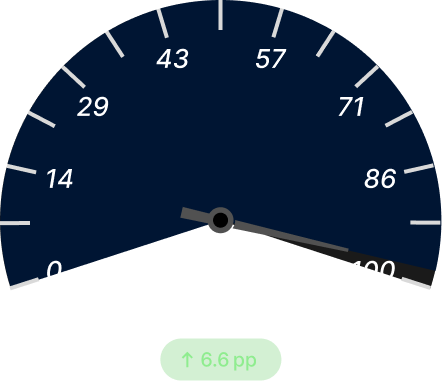
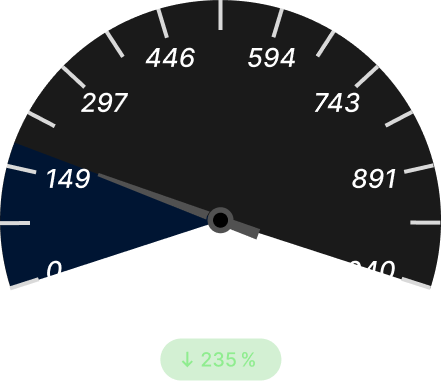
Avg. Delay Cost/Shipment - $29
Before AI:$ 37
After AI:$ 8
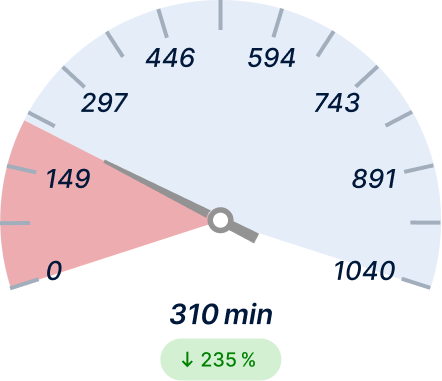
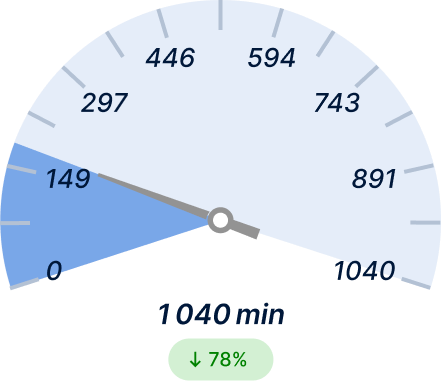
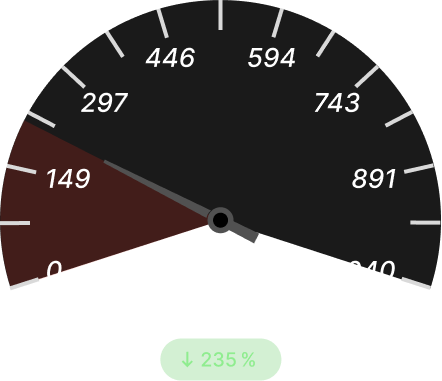
Scrap Cost/Yr ↓ 28%
Before AI:4.3 kg
After AI: 3.1 kg
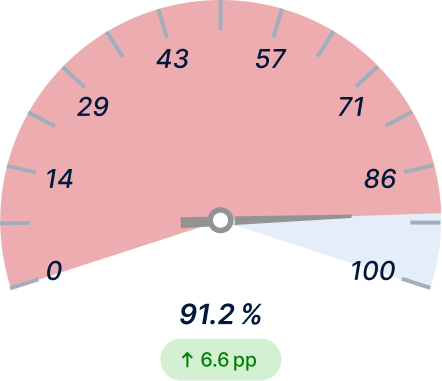
On‑Time Delivery (OTD)
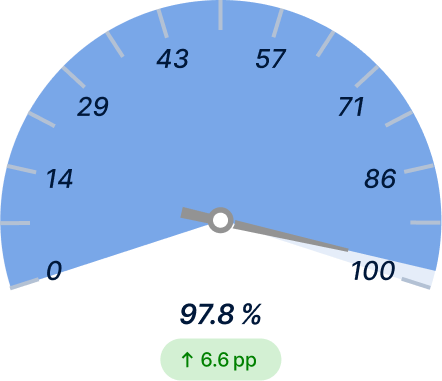
Empty‑Mile Ratio
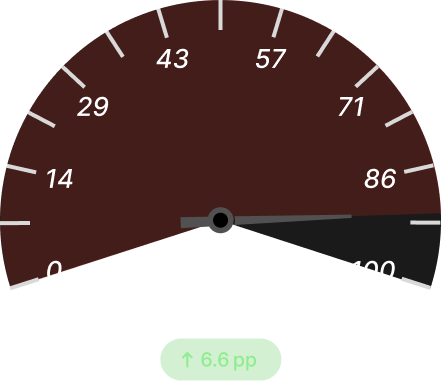
Warehouse Pick Accuracy
Why Change?
Pain-Point Matrix
Particle Contamination
Sub‑micron particles ruin dies late in the flow.
View Our AI Fix
View Our AI Fix
Particle Contamination
ML HC optical inspection + airflow CFD model predicts hotspots & triggers filter change.
View On‑Screen Friction
View On‑Screen Friction
Lithography Overlay Drift
Nanometer mis‑alignment forces costly rework.
View Our AI Fix →
View Our AI Fix →
Lithography Overlay Drift
Real‑time APC uses ML‑based scanner drift compensation & wafer map feedback.
View On‑Screen Friction
View On‑Screen Friction
CMP Endpoint Guesswork
Over‑polish eats yield; under‑polish hurts planarity.
View Our AI Fix
View Our AI Fix
CMP Endpoint Guesswork
Acoustic + vibration LSTM predicts endpoint; closed‑loop controller stops at 0.1µm.
View Our AI Fix
View Our AI Fix
Etch Recipe Drift
Plasma variation creeps across lots.
View Our AI Fix
View Our AI Fix
Etch Recipe Drift
Edge IoT sensors feed LSTM anomaly detection; triggers reroute or dry‑ice top‑up.
View On-Screen Friction
View On-Screen Friction
Unplanned Tool Downtime
Scanner or furnace halt derails cycle‑time.
View Our AI Fix
View Our AI Fix
Unplanned Tool Downtime
Multi‑sensor predictive maintenance—vibration, temperature, vacuum—alerts 48h ahead.
View On-Screen Friction
View On-Screen Friction
Data Silos (FDC / SPC / MES)
Engineers juggle spreadsheets & log files.
View Our AI Fix
View Our AI Fix
Data Silos (FDC / SPC / MES)
Unified data mesh auto‑ingests SECS/GEM, EDA, CSV; live control‑tower analytics.
View On-Screen Friction
View On-Screen Friction
Energy‑hungry Furnaces
1200°C diffusion soaks spike utility bills.
View Our AI Fix
View Our AI Fix
Energy‑hungry Furnaces
RL schedules lot batching, tunes ramp‑soak; cuts kWh 15‑25%.
View On-Screen Friction
View On-Screen Friction
Reticle & Mask QA Bottleneck
Defective photomasks kill entire lots.
View Our AI Fix
View Our AI Fix
Reticle & Mask QA Bottleneck
CV system inspects masks at 2 µm resolution; flags defects before exposure.
View On-Screen Friction
View On-Screen Friction
Supply‑Chain Strain (Ingot & Gas)
Polysilicon & specialty gas shortages delay WIP.
View Our AI Fix
View Our AI Fix
Supply‑Chain Strain (Ingot & Gas)
Demand‑sensing AI forecasts usage, auto‑triggers vendor managed inventory.
View On-Screen Friction
View On-Screen Friction
AI Solutions
APC Overlay Optimiser
Key points
- Natural-language root-cause search for overlay variances.
- Auto-generates DOE (Design of Experiments) recommendations.
- Links SEMI E10 / EDA logs on-click for traceability.
Vision Defect Inspection
Key points
- Uses deep-learning CV models for sub-micron defect detection.
- Achieves >98% classification accuracy in wafer image analysis.
- Supports SEM / AOI integration for inline QA automation.
Energy Scheduler
Key points
- AI dynamically balances fab energy consumption and process loads.
- Reduces peak-hour electricity cost by up to 18%.
- Integrates with grid-level predictive demand APIs.
Predictive Maintenance
Key points
- Detects equipment degradation patterns using vibration and sensor data.
- Extends tool lifespan by up to 30%.
- Compatible with MES and SPC data streams.
Yield Explorer LLM
Key points
- LLM-based assistant for yield diagnostics and fab queries.
- Generates instant yield-correlation reports from multi-lot data.
- Reduces engineering analysis time by up to 60%.
Supply‑Chain Forecaster
Key points
- Predicts raw material and component availability disruptions.
- Uses time-series AI to optimize buffer levels.
- Syncs directly with procurement dashboards and ERP APIs.
Under the hood
Technical Architecture
- WaferSense sensors - SECS/GEM
- OPC‑UA gateways
- WebSocket < 25ms
- PyTorch Lightning → ONNX
- Triton inference
- Graph Neural Nets for wafer cluster
- RL overlay optimiser
- FastAPI micro‑services (Yield Explorer, APC Agent, Energy Scheduler)
- Confluent Kafka
- Snowflake lakehouse
- Delta clone
- EDA (Equipment Data Acquisition) feeds
- Kubeflow
- Argo CD
- ISO27001 & SEMI E10 event codes
- React + D3 dashboards
- Grafana tool metrics
- AR glasses for cleanroom engineers
Implementation Blueprint
Phase 1: Discover & Data Audit
- Tool walk‑through
- sensor map
- sample wafer map extraction
- ROI hypothesis.
Phase 2: Rapid Pilot
- One tool cluster + Yield Explorer instrumented
- baseline KPIs captured
Phase 3: Shadow validation
- 24×7 inference shadow
- engineer feedback loop
Phase 4: Production Launch
- APC/MES integration live
- Staff training
- SLA activated
Phase 5: Continuous Optimisation
- KPI review
- nightly model retrain
- feature backlog burn‑down
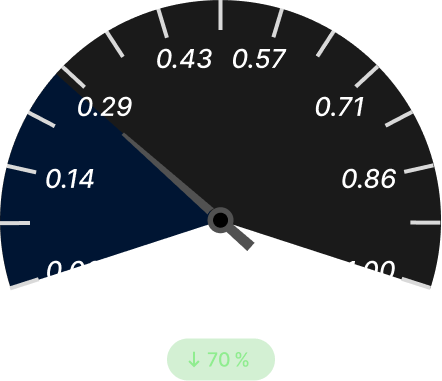
ROI Calculator
Yield Gain:
Downtime Savings:
Energy Savings:
Payback:
Trust & Compliance Badges


The Fast Lane
Give us 30minutes. We'll map a milestone‑based AI path that pays for itself.
Why Choose Us
Proven Results,
Trusted by Experts
Futuristic Visuals
Our interfaces render high-resolution wafer maps, defect signatures, and process analytics with unmatched clarity engineered for semiconductor precision.
Trusted by Industry Leaders
Validated by global fabs and semiconductor OEMs meeting rigorous standards for data integrity, metrology, and statistical process control.
Loss Aversion
Without AI:
Defects propagate across lotsYield loss becomes unpredictableEngineering cycles slow down
We help isolate root causes before they impact high-value wafers.
Small Steps, Big Impact
One short session can highlight where defect classification, FDC analytics, and GPU-based inference boost yield performance.